OpenStack Tenants and Nagios Integration Script
Hi All! A detailed article to integrate OpenStack tenants with Nagios! While my promised articles on implementing High Availability within OpenStack (which I’ve done now for Icehouse and Kilo) are still just in my brain, here’s something else to keep my blog happy with a little more content 🙂
Scenario: Nagios Core and Telemetry
So you have Telemetry installed and running (bonus questions: did you get the Telemetry controller build process completely automated? And handle mongodb database size?) And you have a functional Nagios core. So how to integrate your OpenStack Tenants as elements in your Nagios?
Here’s my answer, which unfortunately does rely on running from my Nagios server rather than trapping SNMP alerts sent from the Telemetry (Ceilometer) server. And the iteration process below is kinda slow and therefore lame. But on the good side: it gets my OpenStack Tenants shown in Nagios core!
Here’s a picture of how the tenants look when displayed in Nagios…note that I created a Nagios “hostgroup” called openstack-tenants so that they all show up together:
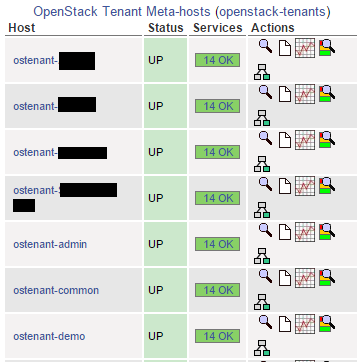
Approach
We’ll treat each OpenStack tenant as a Nagios “host” record. That means, since we’re using Nagios Core, that we’ll provide a separate configuration file that defines each OpenStack tenant with information filled in. Fortunately, Nagios permits descriptive information about each host to be expressed using standard HTML tables; we take advantage of this as shown:
define host {
  host_name                      ostenant-common
  hostgroups                     openstack-tenants
  retry_interval                 1
  notification_options           n
  check_interval                 5
  contact_groups                 admins
  register                       1
  max_check_attempts             10
  name                           ostenant-common
  check_period                   24x7
  notification_interval          120
  use                            generic-host
  check_command                  command-true
  notification_period            24x7
  notes                          <table><tr><th>ID</th><td>3e263cf06ad0460882f20ca402b6508b</td></tr><tr><th>Name</th><td>common</td></tr><tr><th>Description</th><td>Common services</td></tr><tr><th>Enabled?</th><td>True</td></tr><tr><th>Hypervisors</th><td>lposhostx020.hlsdev.local:lposhostx010.hlsdev.local:</td></tr><tr><th>Total VMs</th><td>3</td></tr><tr><th>Active VMs</th><td>3</td></tr><tr><th>Disk (GB)</th><td>24</td></tr><tr><th>vCPUs</th><td>5</td></tr><tr><th>RAM</th><td>2053</td></tr></table>
  notes_url                      /nagios/cgi-bin/status.cgi?host=ostenant-common
}
We’ll generate this code by analyzing each OpenStack Tenant. The result will be a display that looks like the following:
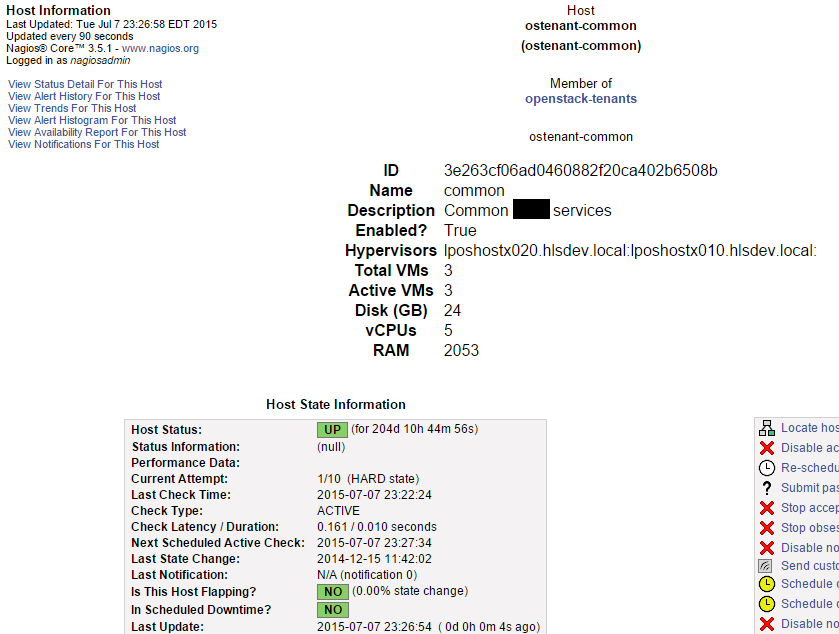
Finally…by using Telemetry calls I get a whole bunch of detail information about the tenant:
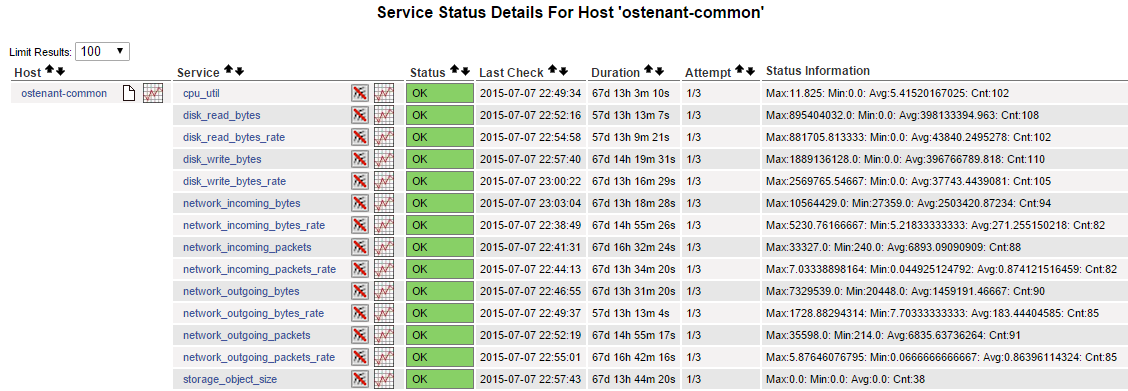
The way I get this Telemetry information is by using a Nagios command script, which I wrote and installed to the Nagios plugins folder (/usr/lib64/nagios/plugins on my CentOS 6.5 x64 server) as follows:
define command {
        command_line                   $USER1$/check_ceilometer -H $HOSTNAME$ -e "$ARG1$" -s cpu_util -n
        command_name                   check_ceilometer_cpu_util
}

define command {
        command_line                   $USER1$/check_ceilometer -H $HOSTNAME$ -e "$ARG1$" -s disk.read.bytes -n
        command_name                   check_ceilometer_disk_read_bytes
}
...lots more commands, one for each function supported
There are two scripts which I need to have for this to work, along with OpenStack credentials (and clients installed) on the Nagios server. I don’t like that approach (having credentials in a shell script!) but that’s on my list of Things To Fix! I mitigate the risk by making the credentials readable only by my service account on Nagios, and hiding the Nagios server from the outside world.
#!/bin/bash
# check_ceilometer ABr, 20141212
# invoke ceilometer API for Nagios integration
# Change Log
# ----------
# 20150422, ABr: integrated to puppet

# default values (overridden by arguments)
TENANT=demo
SERVICE='cpu_util'
IGNORE=0
THRESHOLD='50.0'
CRITICAL_THRESHOLD='80.0'

# assume file exists
source ~/lvosksclu100-rc-telemetry-access

# function to print the help info
printusage() {
  echo "This plug-in uses the OpenStack Ceilometer API to let Nagios query Ceilometer metrics of VMs."
  echo "usage:"
  echo "ceilometer-call -q [event|sample|statistics] -e [tenant_name] -v [server_name] -s metric_name -t nagios_warning_threshold -T nagios_critical_threshold"
  echo "-h: print this message"
  echo "-H: nagios hostname"
  echo "-e: tenant name"
  echo "-s service: valid name from ceilometer meter-list"
  echo "-n object: no thresholds (ignore)"
  echo "-t threshold: Threshold value which causes Nagios to create a warning message"
  echo "-T threshold for alert: Threshold value which causes Nagios to send a critical alert message"
  exit ${EXITPROB}
}

getvalue() {
  local l_tmp="$1"
  local l_col="$2"
  local l_value=$(cat $l_tmp | cut -d'|' -f $l_col)
  if [ -z "$l_value" ] ; then
    l_value="0"
  else
    l_value=$(echo $l_value | sed -e 's# ##g')
    if echo "$l_value" | grep --quiet -v -e '^[0-9\.EPep]\+$' 2>/dev/null; then
      l_value="0"
    fi
  fi
  set +x
  echo $l_value
  return 0
}

#parse the arguments
while getopts ":hH:e:s:nt:T:" opt; do
  case $opt in
    H )     l_HOSTNAME=${OPTARG};;
    h )     printusage;;
    e )     TENANT=${OPTARG};;
    s )     SERVICE=${OPTARG};;
    n )     IGNORE=1;;
    t )     THRESHOLD=${OPTARG};;
    T )     CRITICAL_THRESHOLD=${OPTARG};;
    ? )     printusage;;
  esac
done

if [ ! -z "$l_HOSTNAME" ]; then
  if echo $l_HOSTNAME | grep --quiet -e "^ostenant-" 2>&1; then
    TENANT=$(echo $l_HOSTNAME | sed -e 's#^ostenant-\(.*\)#\1#')
  fi
fi

# very simple plugin :)
l_tmp="/tmp/ceilometer.$$"
ceilometer --os-tenant-name=$TENANT statistics -m $SERVICE | head -n -1 | tail -n 1 2>/dev/null > $l_tmp 2>&1
l_max=$(getvalue "$l_tmp" 5)
l_min=$(getvalue "$l_tmp" 6)
l_avg=$(getvalue "$l_tmp" 7)
l_count=$(getvalue "$l_tmp" 9)
#logger "ceilometer: rm -f \"$l_tmp\""
rm -f "$l_tmp"
l_db_name=$SERVICE
[ "$l_db_name" = "cpu_util" ] && l_db_name="cpu"
echo "Max:$l_max; Min:$l_min; Avg:$l_avg; Cnt:$l_count|$l_db_name=$l_avg;;;$l_min;$l_max"
echo $RETURNCODE
This command script outputs performance information in a format suitable for Nagios Graph so – over time – I can even get trends on CPU / RAM / HDD usage within a tenant.
Integrate Nagios with OpenStac
The actual script I use to create the faux Nagios “hosts” as representations of OpenStack tenants follows. Here’s the script – with annotations. I run the script as part of a cron job every day at 2:45AM because the script is, well, slow. (Remember: it’s iterating Every VM within Every Tenant in the OpenStack cluster.) However, the script could be run much more often if desired!
#!/bin/bash
# sab-lvos-telemetry-nagios.sh, ABr, 20141212
# Integrate OpenStack Telemetry with Nagios
# Change Log:
# -----------
# 20141212, ABr: initial creation
# 20141215, ABr: placing into production
# 20150102, ABr: save last run

########################################################################
# globals

# our runtime directory - accounts for being run in separate shell or
# from source.
g_SAB_LVOS_TELEMETRY_DIR_TEST="$(dirname "$0" 2>&1)"
g_SAB_LVOS_TELEMETRY_RC_TEST=$?
if [ $g_SAB_LVOS_TELEMETRY_RC_TEST -eq 0 ]; then
  g_SAB_LVOS_TELEMETRY_NAGIOS_DIR_RUN="$(cd $(dirname "$0"); pwd)"
else
  g_SAB_LVOS_TELEMETRY_NAGIOS_DIR_RUN="$(pwd)"
fi

# the folder where we stuff extra files for Nagios to include.
# be sure /etc/nagios/nagios.cfg has:
#   cfg_dir=/etc/nagios/extra-cfg
g_SAB_LVOS_TELEMETRY_NAGIOS_DIR_CFG='/etc/nagios/extra-cfg'

# the resource file with your OpenStack credentials in it. yes, this
# is horrible...it's on my many backlogged tasks to Fix This.
g_SAB_LVOS_TELEMETRY_NAGIOS_FILE_RC_NAME='openstack_rc_file'
g_SAB_LVOS_TELEMETRY_NAGIOS_FILE_RC_PATH="$g_SAB_LVOS_TELEMETRY_NAGIOS_DIR_RUN/$g_SAB_LVOS_TELEMETRY_NAGIOS_FILE_RC_NAME"

# temp file where we put our results
g_SAB_LVOS_TELEMETRY_NAGIOS_FILE_TENANTS_NAME='tenants'
g_SAB_LVOS_TELEMETRY_NAGIOS_FILE_TENANTS_TMP_PATH="/tmp/$g_SAB_LVOS_TELEMETRY_NAGIOS_FILE_TENANTS_NAME.$$"
g_SAB_LVOS_TELEMETRY_NAGIOS_FILE_TENANTS_PATH="$g_SAB_LVOS_TELEMETRY_NAGIOS_DIR_CFG/$g_SAB_LVOS_TELEMETRY_NAGIOS_FILE_TENANTS_NAME.cfg"
g_SAB_LVOS_TELEMETRY_NAGIOS_LAST_RUN_PATH="/tmp/$g_SAB_LVOS_TELEMETRY_NAGIOS_FILE_TENANTS_NAME.lastrun"

g_SAB_LVOS_TELEMETRY_NAGIOS_RC_OK=0
g_SAB_LVOS_TELEMETRY_NAGIOS_RC_ERROR=1

########################################################################
# functions

# cleanup: called before exit
function sab-lvos-telemetry-nagios-i-cleanup {
  yes | cp $g_SAB_LVOS_TELEMETRY_NAGIOS_FILE_TENANTS_TMP_PATH $g_SAB_LVOS_TELEMETRY_NAGIOS_LAST_RUN_PATH
  rm -f $g_SAB_LVOS_TELEMETRY_NAGIOS_FILE_TENANTS_TMP_PATH
  return 0
}

# exit system with cleanup
function sab-lvos-telemetry-nagios-i-exit {
  local l_rc=$1
  shift
  [ "$l_rc" -ne 0 ] && echo -n "ERROR: "
  echo "$* ($l_rc)"
  sab-lvos-telemetry-nagios-i-cleanup
  exit $l_rc
}

# exit only if error (where first parm is non-zero)
function sab-lvos-telemetry-nagios-i-error-exit {
  local l_rc=$1
  [ "$l_rc" -ne 0 ] && sab-lvos-telemetry-nagios-i-exit $*
  return 0
}

# read OpenStack file and source credentials
function sab-lvos-telemetry-nagios-i-source-rc {
  [ ! -f "$g_SAB_LVOS_TELEMETRY_NAGIOS_FILE_RC_PATH" ] && \
    sab-lvos-telemetry-nagios-i-error-exit $g_SAB_LVOS_TELEMETRY_NAGIOS_RC_ERROR \
    "Missing $g_SAB_LVOS_TELEMETRY_NAGIOS_FILE_RC_NAME"
  source "$g_SAB_LVOS_TELEMETRY_NAGIOS_FILE_RC_PATH"
  return 0
}

# load all tenants (assumes that OpenStack credentials are set)
function sab-lvos-telemetry-nagios-i-get-tenants {
  # note that, as of latest OpenStack clients, keystone is deprecated.
  # so we ignore errors (at some point I'll update to use "openstack" client)
  local l_tenant_ids=$(keystone tenant-list 2>/dev/null | tail -n +4 | head -n -1 | sort -k 3 | cut -d'|' -f 2)
  local l_rc=$?
  sab-lvos-telemetry-nagios-i-error-exit $l_rc $l_tenant_ids
  echo $l_tenant_ids
  return 0
}

# we have an OpenStack tenant ID, so get the details to put into Nagios
function sab-lvos-telemetry-nagios-i-tenant-dtl {
  local l_tenant_id=$1
  local l_attr=$2
  local l_result=$(keystone tenant-get $l_tenant_id 2>/dev/null | grep -e "| \+$l_attr" | cut -d'|' -f 3)
  local l_rc=$?
  sab-lvos-telemetry-nagios-i-error-exit $l_rc "Tenant $l_tenant_id: " $l_result
  echo $l_result
  return 0
}

# we have an OpenStack VM's ID, so get its details to analyze
function sab-lvos-telemetry-nagios-i-vm-dtl {
  local l_vm_id=$1
  local l_attr=$2
  local l_result=$(nova show $l_vm_id 2>&1 | grep -e "| \+$l_attr" | cut -d'|' -f 3)
  local l_rc=$?
  sab-lvos-telemetry-nagios-i-error-exit $l_rc "VM $l_vm_id: " $l_result
  echo $l_result
  return 0
}

# an OpenStack "flavor" defines disk / CPU / RAM usage. we get these
# details so we can determine how many resources an OpenStack tenant is
# using and report that data to Nagios.
function sab-lvos-telemetry-nagios-i-flavor-dtl {
  local l_flavor_id=$1
  local l_attr=$2
  local l_result=$(nova flavor-show $l_flavor_id 2>&1 | grep -e "| \+$l_attr" | cut -d'|' -f 3)
  local l_rc=$?
  sab-lvos-telemetry-nagios-i-error-exit $l_rc "Flavor $l_flavor_id: " $l_result
  echo $l_result
  return 0
}

# here's the magic sauce where we take an OpenStack tenant and get lots of
# information that we can then display within Nagios.
function sab-lvos-telemetry-nagios-i-tenant-metadisplay {
  local l_tenant_id="$1"
  local l_tenant_name="$2"
  local l_tenant_description="$3"
  local l_tenant_enabled="$4"

  # first, get the list of VMs
  local l_tenant_vms=$(nova --os-tenant-id=$l_tenant_id list 2>&1 | tail -n +4 | head -n -1 | cut -d'|' -f 2)

  # and we do some countin' to find how many resources this tenant uses...
  local l_ctr=0
  local l_active=0
  local l_vcpus=0
  local l_ram=0
  local l_disk=0
  local l_used_hosts=''
  for i_tenant_vm in $l_tenant_vms; do
    l_ctr=$((l_ctr+1))

    # attributes we want to analyze
    local l_status=$(sab-lvos-telemetry-nagios-i-vm-dtl $i_tenant_vm status)
    local l_flavor_text=$(sab-lvos-telemetry-nagios-i-vm-dtl $i_tenant_vm flavor)
    local l_hostname=$(sab-lvos-telemetry-nagios-i-vm-dtl $i_tenant_vm 'OS-EXT-SRV-ATTR:hypervisor_hostname')

    # is the VM active?
    [ "$l_status" = "ACTIVE" ] && l_active=$((l_active+1))

    # get the HDD / RAM / CPU information used by this VM
    local l_flavor_id=$(echo $l_flavor_text | sed -e 's#.*(\(.*\)).*#\1#')
    local l_flavor_disk=$(sab-lvos-telemetry-nagios-i-flavor-dtl $l_flavor_id disk)
    local l_flavor_ram=$(sab-lvos-telemetry-nagios-i-flavor-dtl $l_flavor_id ram)
    local l_flavor_vcpus=$(sab-lvos-telemetry-nagios-i-flavor-dtl $l_flavor_id vcpus)

    # add to totals
    l_disk=$((l_vcpus+$l_flavor_disk))
    l_vcpus=$((l_vcpus+$l_flavor_vcpus))
    l_ram=$((l_vcpus+$l_flavor_ram))

    # append hostname to used hosts
    if echo $l_used_hosts | grep --quiet -v -e "$l_hostname:"; then
      l_used_hosts=$(echo "$l_hostname:$l_used_hosts" | sort -t':')
    fi
  done

  # get the results in a table format we can feed to Nagios
  echo '<table><tr><th>ID</th><td>'$l_tenant_id'</td></tr><tr><th>Name</th><td>'$l_tenant_name'</td></tr><tr><th>Description</th><td>'$l_tenant_description'</td></tr><tr><th>Enabled?</th><td>'$l_tenant_enabled'</td></tr><tr><th>Hypervisors</th><td>'$l_used_hosts'</td></tr><tr><th>Total VMs</th><td>'$l_ctr'</td></tr><tr><th>Active VMs</th><td>'$l_active'</td></tr><tr><th>Disk (GB)</th><td>'$l_disk'</td></tr><tr><th>vCPUs</th><td>'$l_vcpus'</td></tr><tr><th>RAM</th><td>'$l_ram'</td></tr></table>'
  return 0
}

# build meta-data for one tenant
function sab-lvos-telemetry-nagios-i-bld-tenant-meta {
  local l_tenant_id=$i

  echo "  Getting basic tenant info..."
  local l_tenant_name=$(sab-lvos-telemetry-nagios-i-tenant-dtl $i_tenant_id name)
  local l_tenant_nagios_name="ostenant-$l_tenant_name"
  local l_tenant_description=$(sab-lvos-telemetry-nagios-i-tenant-dtl $i_tenant_id description)
  local l_tenant_notes_url="/nagios/cgi-bin/status.cgi?host=$l_tenant_nagios_name"
  local l_tenant_enabled=$(sab-lvos-telemetry-nagios-i-tenant-dtl $i_tenant_id enabled)

  echo "  Getting VM details for tenant..."
  local l_tenant_metadisplay=$(sab-lvos-telemetry-nagios-i-tenant-metadisplay $i_tenant_id "$l_tenant_name" "$l_tenant_description" "$l_tenant_enabled")

  # this is where we export information to Nagios. we treat the OpenStack tenant
  # as a Nagios "host"
  cat >> "$g_SAB_LVOS_TELEMETRY_NAGIOS_FILE_TENANTS_TMP_PATH" << EOF
define host {
  host_name                      $l_tenant_nagios_name
  hostgroups                     openstack-tenants
  retry_interval                 1
  notification_options           n
  check_interval                 5
  contact_groups                 admins
  register                       1
  max_check_attempts             10
  name                           $l_tenant_nagios_name
  check_period                   24x7
  notification_interval          120
  use                            generic-host
  check_command                  command-true
  notification_period            24x7
  notes                          $l_tenant_metadisplay
  notes_url                      $l_tenant_notes_url
}
EOF

  return 0
}

# iterate over all OpenStack tenants, output information to Nagios for each one.
function sab-lvos-telemetry-nagios-i-bld-all-meta {
  local l_tenant_ids=$*

  echo '' > "$g_SAB_LVOS_TELEMETRY_NAGIOS_FILE_TENANTS_TMP_PATH"
  for i_tenant_id in $l_tenant_ids; do
    echo "Processing tenant '$i_tenant_id'..."
    sab-lvos-telemetry-nagios-i-bld-tenant-meta $i_tenant_id
  done
  return 0
}

# finally, update Nagios from our results. we will restart Nagios if
# we detected a change in the OpenStack tenant display.
function sab-lvos-telemetry-nagios-i-update {
  local l_update=0
  if [ ! -f "$g_SAB_LVOS_TELEMETRY_NAGIOS_FILE_TENANTS_PATH" ]; then
    l_update=1
  else
    if diff "$g_SAB_LVOS_TELEMETRY_NAGIOS_FILE_TENANTS_TMP_PATH" "$g_SAB_LVOS_TELEMETRY_NAGIOS_FILE_TENANTS_PATH" 2>&1 >/dev/null; then
      l_update=1
    fi
  fi
  if [ $l_update -eq 1 ]; then
    echo "Updating Nagios tenant file '$g_SAB_LVOS_TELEMETRY_NAGIOS_FILE_TENANTS_PATH'..."

    # overwrite our existing Nagios configuration file
    yes | cp "$g_SAB_LVOS_TELEMETRY_NAGIOS_FILE_TENANTS_TMP_PATH" "$g_SAB_LVOS_TELEMETRY_NAGIOS_FILE_TENANTS_PATH"
    chown root:nagios "$g_SAB_LVOS_TELEMETRY_NAGIOS_FILE_TENANTS_PATH"
    chmod 640 "$g_SAB_LVOS_TELEMETRY_NAGIOS_FILE_TENANTS_PATH"

    # we have a difference; force Nagios to reload itself
    service nagios restart
  else
    echo "Nagios tenant file '$g_SAB_LVOS_TELEMETRY_NAGIOS_FILE_TENANTS_PATH' is up-to-date."
  fi
  return 0
}

function sab-lvos-telemetry-nagios-run {
  echo "Sourcing RC file..."
  sab-lvos-telemetry-nagios-i-source-rc
  echo "Scanning all tenants..."
  local l_tenant_ids=$(sab-lvos-telemetry-nagios-i-get-tenants)
  sab-lvos-telemetry-nagios-i-bld-all-meta "$l_tenant_ids"
  sab-lvos-telemetry-nagios-i-update $

  # only do this if you want details from our work shown
#  cat $g_SAB_LVOS_TELEMETRY_NAGIOS_FILE_TENANTS_TMP_PATH
  sab-lvos-telemetry-nagios-i-exit 0 "OK"
}

# do the work
sab-lvos-telemetry-nagios-run
Enjoy…and Happy Computing!
Team-oriented systems mentor with deep knowledge of numerous software methodologies, technologies, languages, and operating systems. Excited about turning emerging technology into working production-ready systems. Focused on moving software teams to a higher level of world-class application development. Specialties:Software analysis and development...Product management through the entire lifecycle...Discrete product integration specialist!
Leave a Reply